To properly display this page you need a browser with JavaScript support.
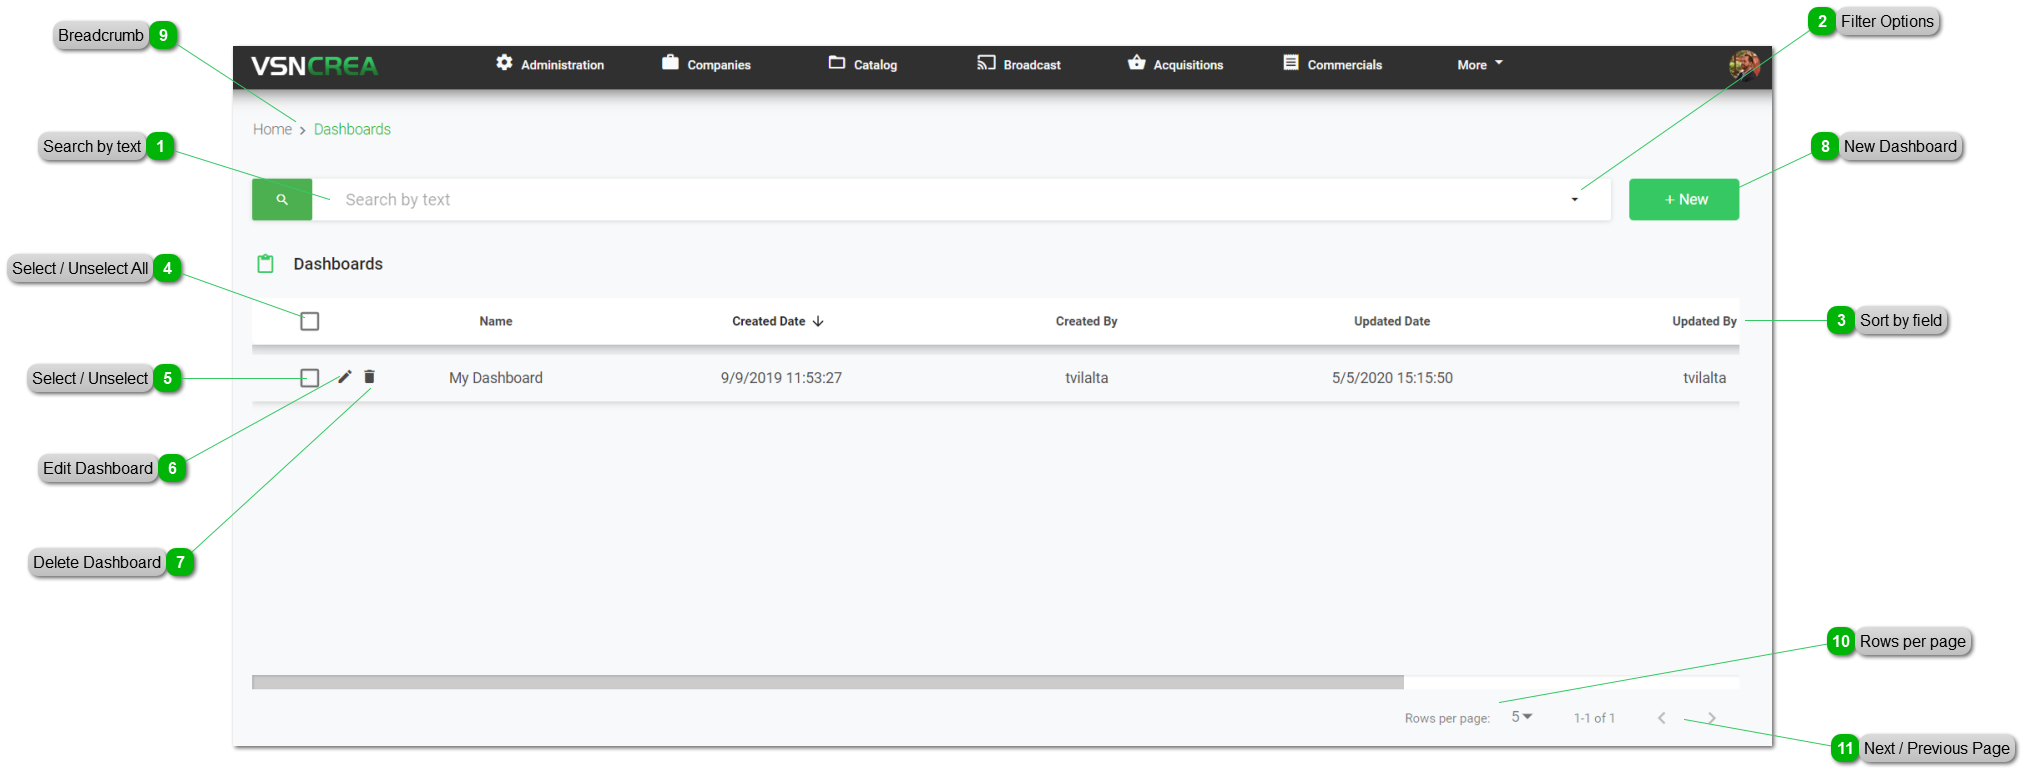
The Dashboard module allows users to combine several reports in the same window to monitor different interesting information of the system at the same time.
To access to the Dashboards, just click on
in the top main menu.
Search by text
Start typing a text and click Enter. The system will show you the results matching with your query
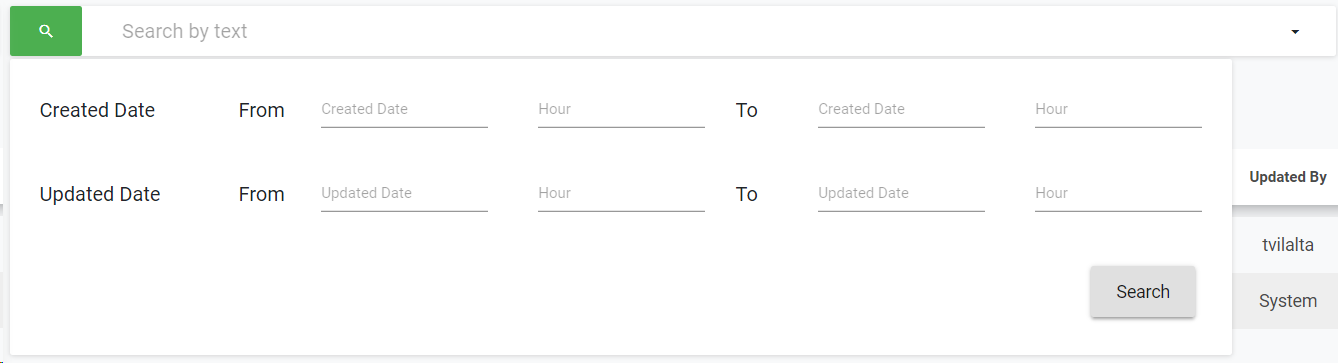
Filter Options
Click the drop down menu to display the filtering options. Select your filters and click on the "Search" button.
Click
to clear the value and remove the filter.
Sort by field You can click on any of the available fields in the columns, to order the results, ascending
or descending
Each user can also change the position of each column just using drag & drop.
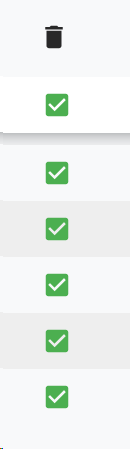
Select / Unselect All
Click on this checkbox to select or unselect all the elements of the list. When selected, the trash icon to delete all will be enabled.
Select / Unselect
To select or unselect individual elements, click each checkbox. When some element is selected, the trash icon to delete them will be enabled.
Edit Dashboard
To edit an existing dashboard:
Mouse over on the element and click the
icon;
or just one click on the selected row.
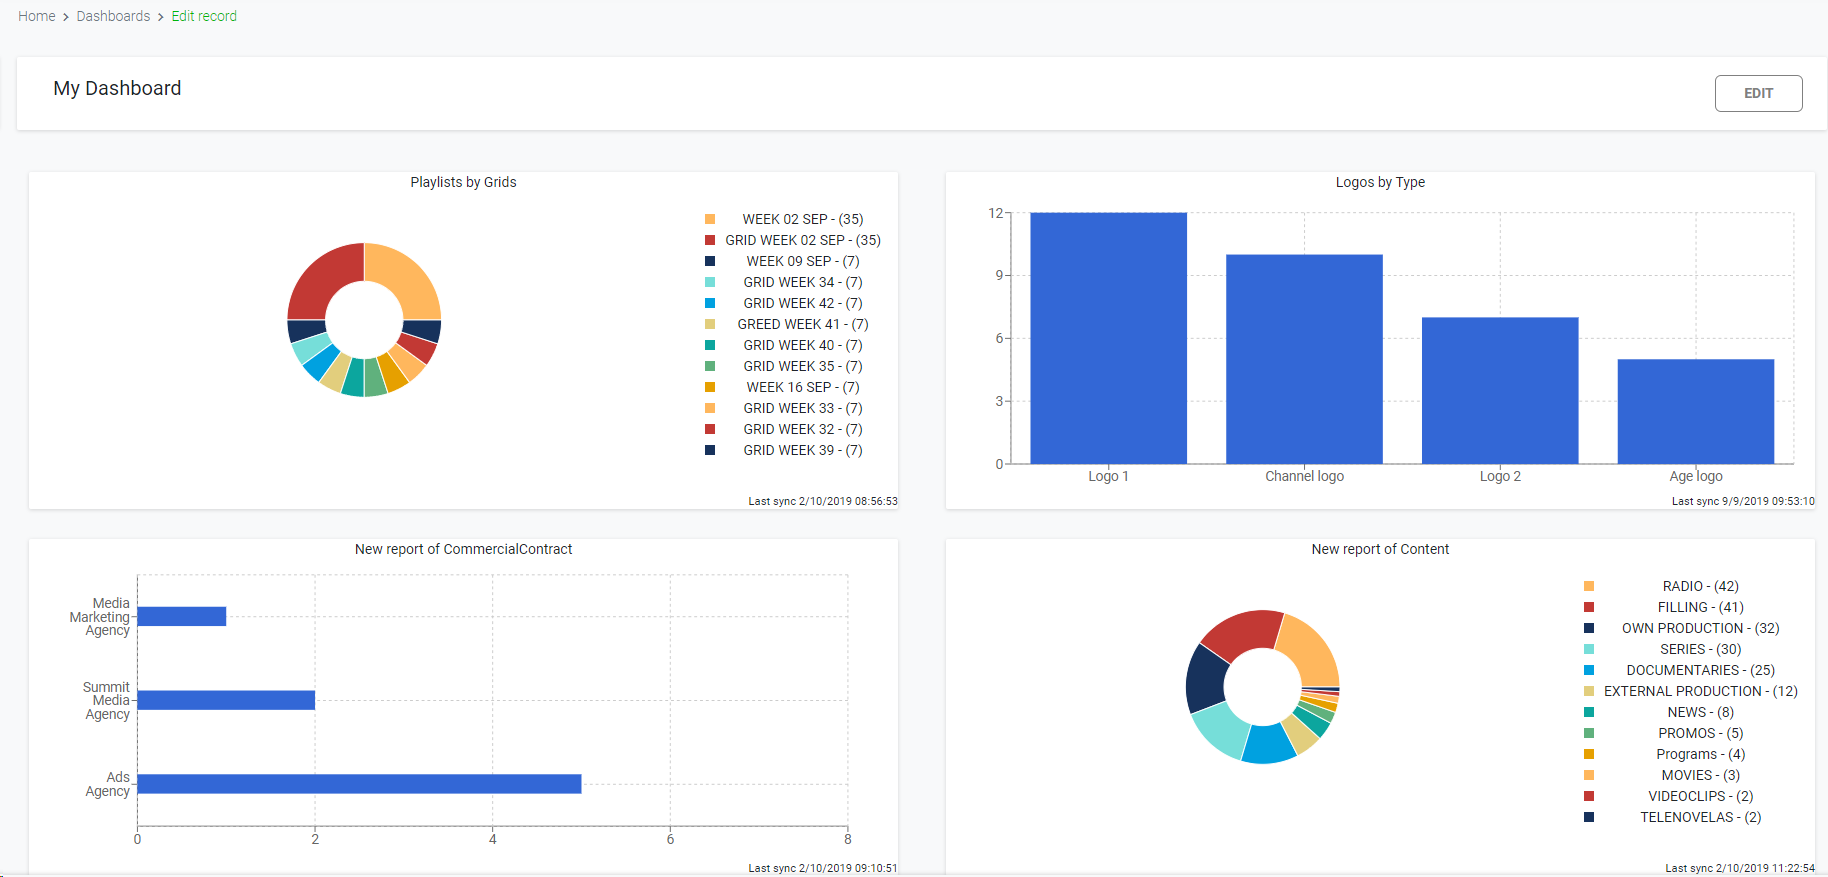
This will open the current dashboard:
Click on
to switch to edit view and modify your dashboard.
Delete Dashboard
To delete a dashboard:
Mouse over the element, and click on the
icon
Select or multi-select them using the checkboxes and click on the top trash icon
This action will show the following dialog:
Click
to delete the selected users, or
to cancel the operation.
New Dashboard
Click on this button to create a new dashboard
Introduce a name for your dashboard
Click on
to
select an existing custom report from the list
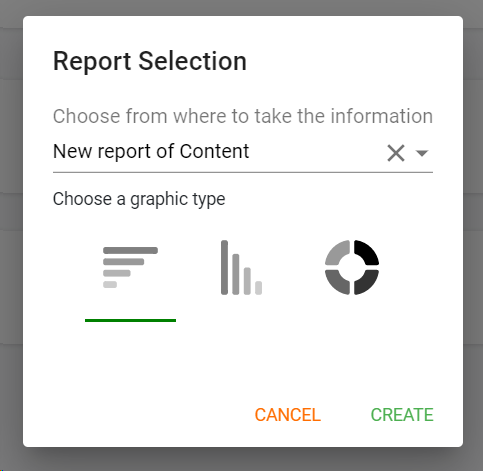
Choose a graphic type (among the available options):
Click on
to add the graphic to your dashboard.
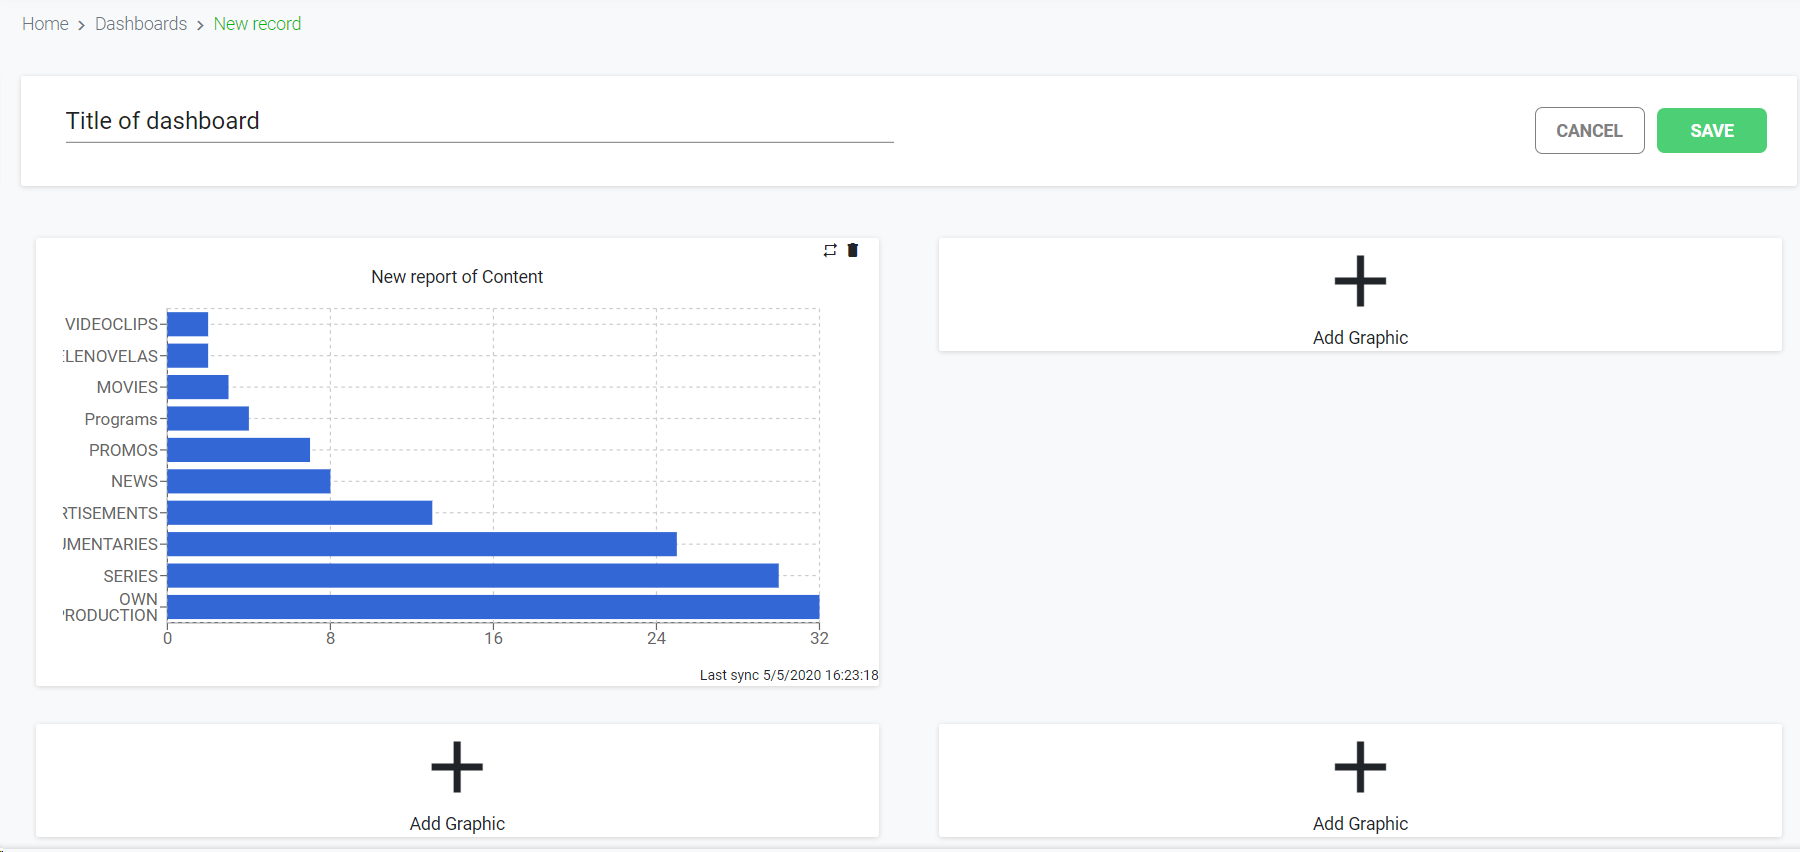
To add more graphics to your dashboard, repeat the previous operations.
Click on
to save your new dashboard.
Remember that you can only use reports that have the graphics enabled. For more information about how to add graphics to your reports, go
here
Breadcrumb
It shows the current page's location within a hierarchy of content to browse history and to provide the navigation tool.
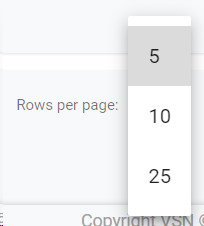
Rows per page Click on the drop down item to select the numbers of rows per page between the available options:
Next / Previous Page Click
to go to the previous page or
to go to the next page


 to switch to edit view and modify your dashboard.
 to delete the selected users, or
  to cancel the operation.
 to select an existing custom report from the list
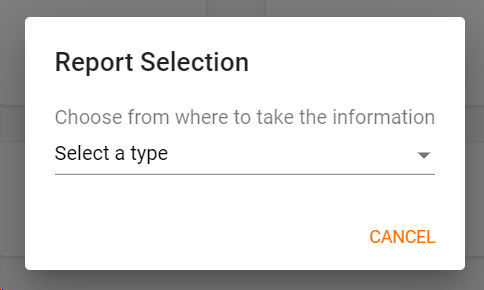
 to save your new dashboard.